External Reference
This tutorial explains how to lock an internal oscillator to an external reference signal and demodulate at the reference frequency or one of its harmonics. This applies to any setup in which the reference signal comes from an external source. The reference should have a sufficiently large amplitude (e.g., TTL level) and low frequency noise to allow for reliable locking.
Note
This tutorial is applicable to all VHFLI instruments. No specific options are required. The user interface has slight differences depending on whether the VHF-MD or VHF-PID options are installed. Screenshots in this tutorial show an instrument with both options installed.
Preparation
Connect the cables as shown in Figure 1. Make sure the VHFLI is powered on and connected to the host computer (see Getting Started for details). The tutorial can be started with the default instrument configuration and default user interface settings. Once LabOne is started, the Setup workspace is shown on the screen. In case some blocks are already present on the canvas, you can remove them by clicking on the “Delete all blocks” button in the top center of the Setup workspace.
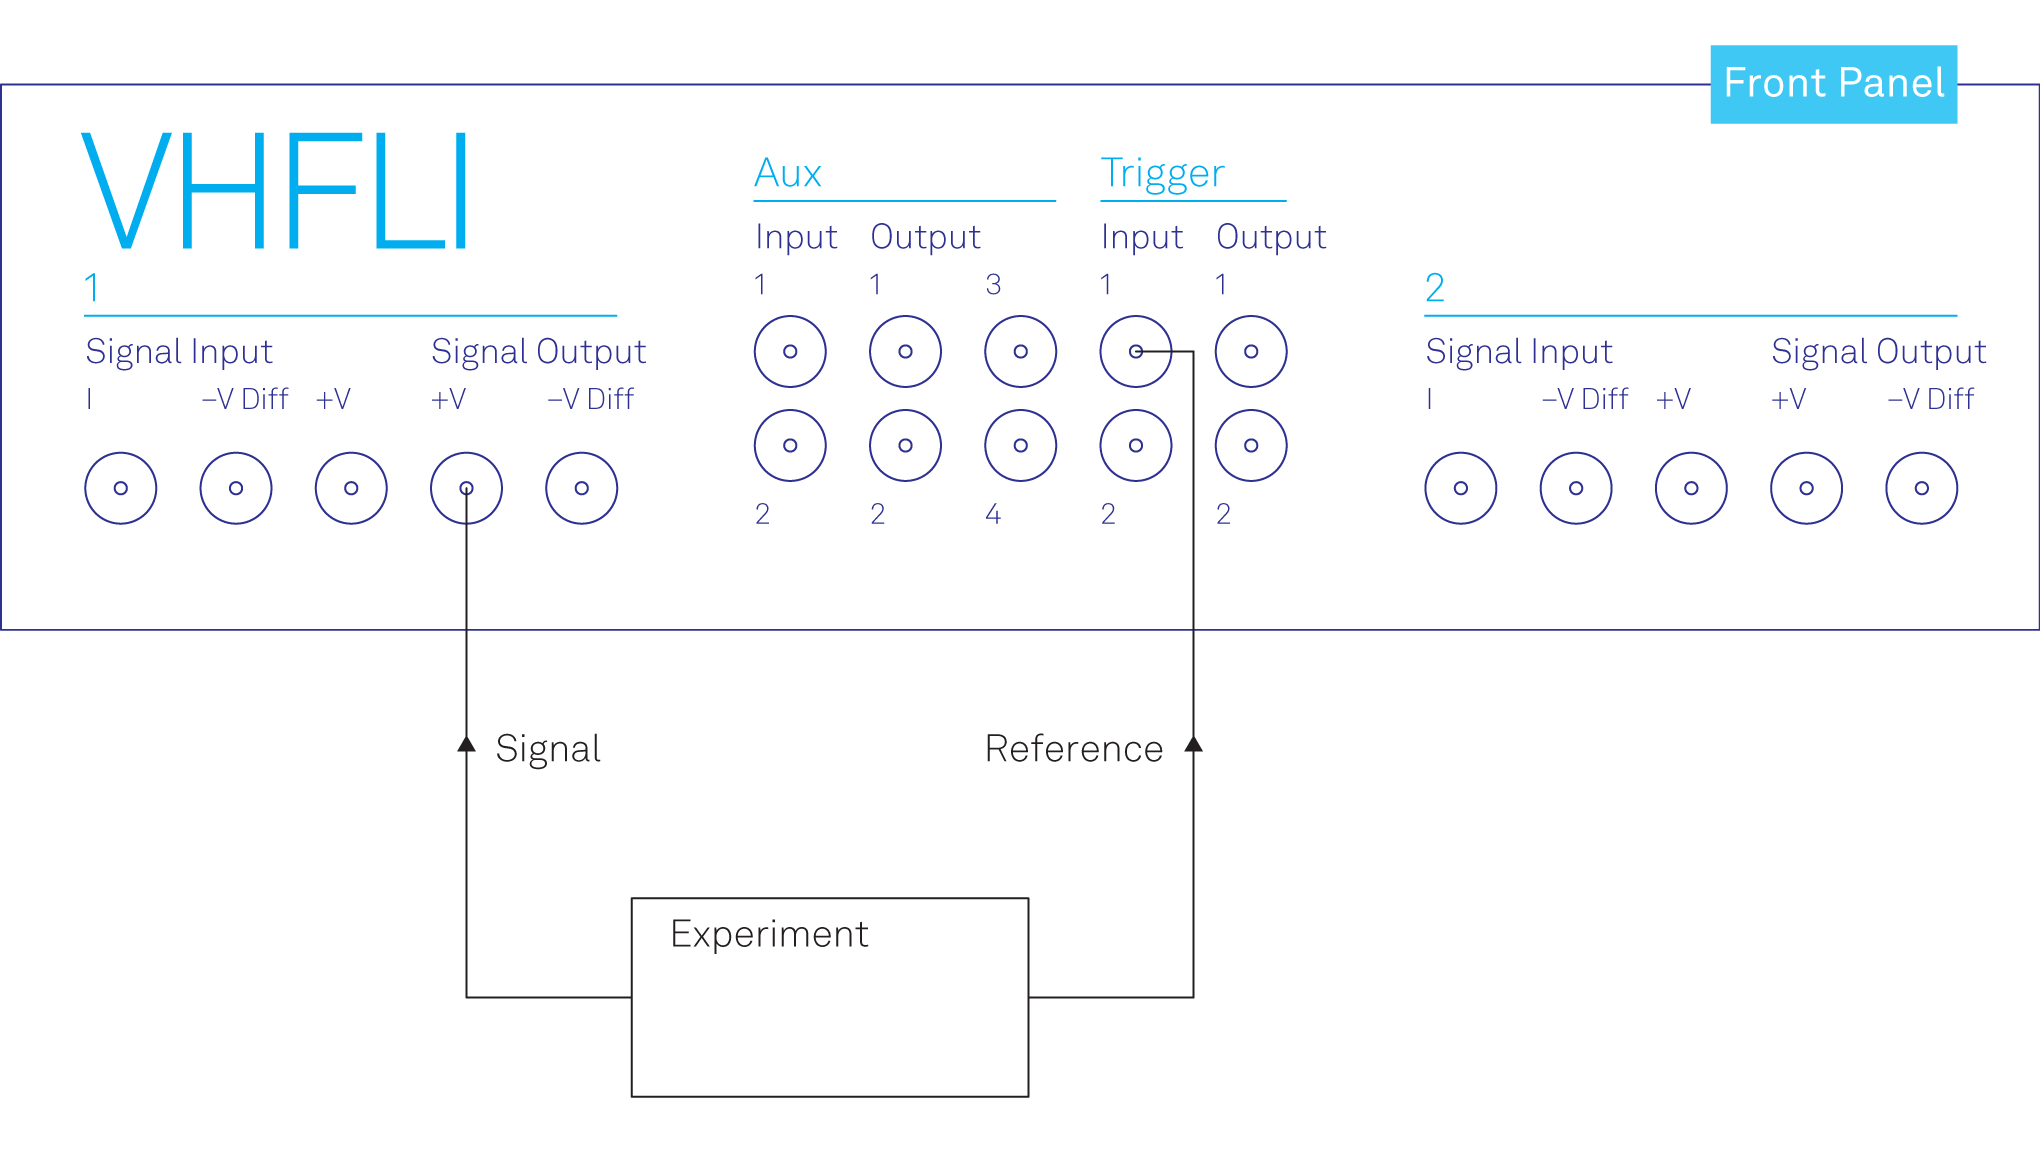
The reference signal is wired from the experiment (e.g. chopper sync signal) to Trigger Input 2 of the VHFLI. In this example, the reference signal is a square wave switching between 0 V and 5 V at 80 Hz.
Locking to an external reference signal
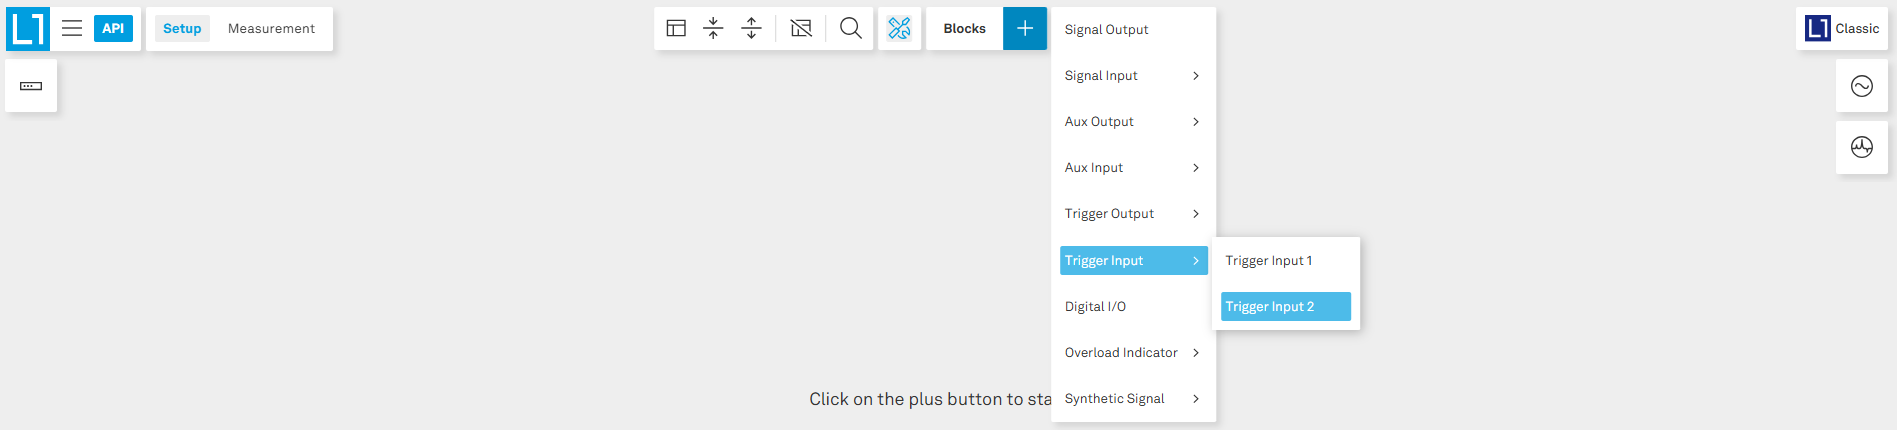
In the Setup workspace, click on the Blocks button (the “+” symbol in the top bar) to open the dropdown menu. Navigate to Trigger Input and select Trigger Input 2 from the submenu as shown in Figure 2. This adds the Trigger Input 2 block to the canvas.
The Trigger Input 2 block will appear on the canvas. Adjust the threshold level if necessary (Figure 3).
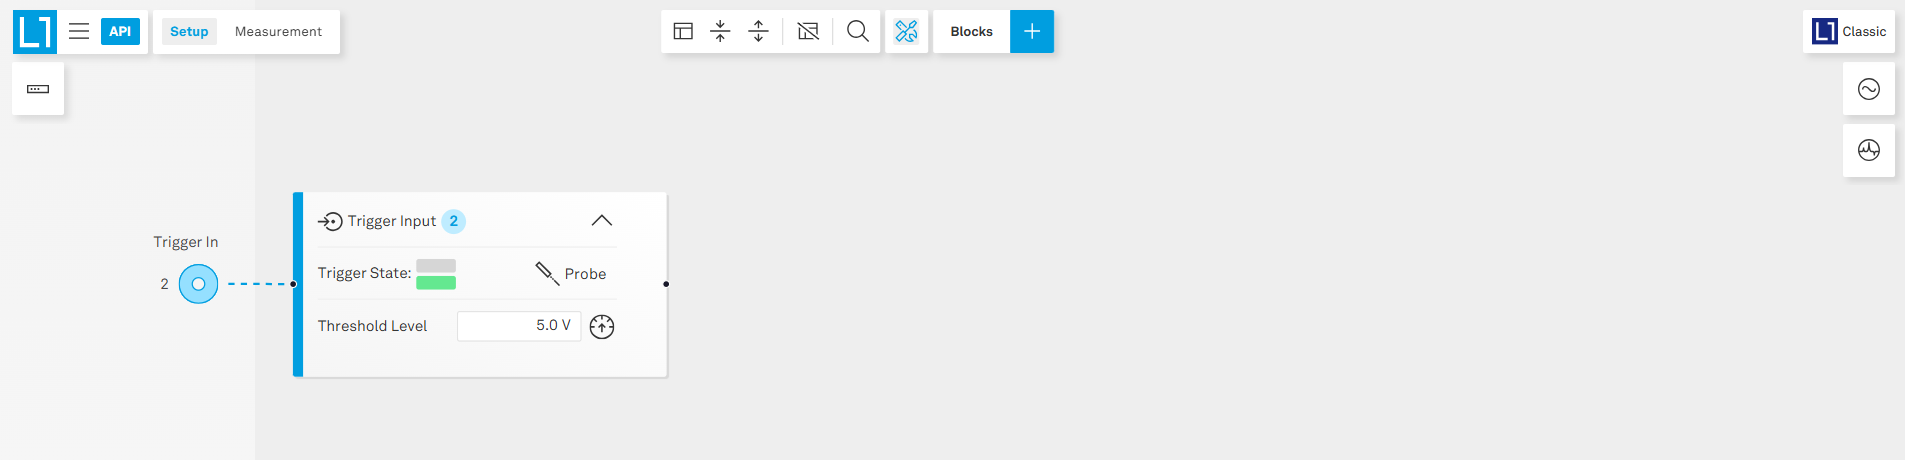
By adjusting the threshold level in the Trigger Input 2 block manually (by entering the threshold level value) or automatically (by clicking on the icon next to the threshold level), the low and high levels of the reference signal are properly detected by the instrument. This is indicated by the two green flags (low and high levels) of Trigger State as seen in Figure 4.
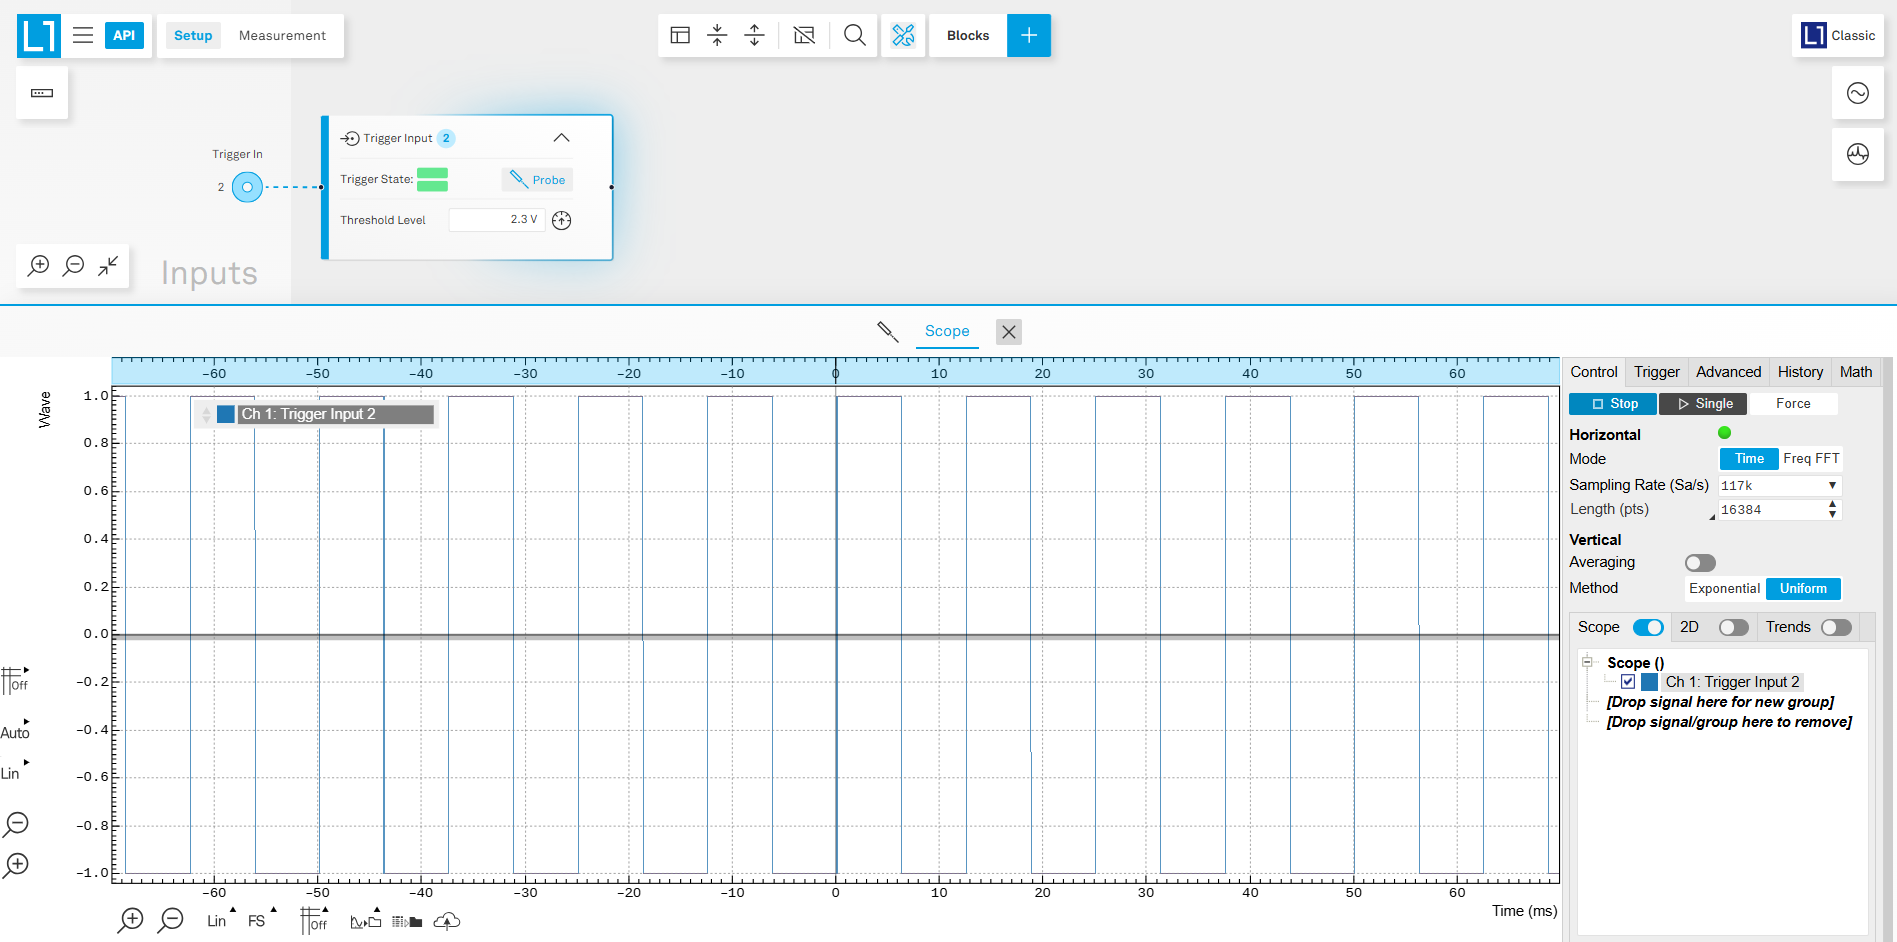
If, for any reason, the two levels are not detected, you can easily inspect the incoming signal at the Trigger Input 2 connector to diagnose potential issues. Simply click on the Probe icon within the Trigger Input 2 block to visualize the reference signal. This will open an oscilloscope instance, showing the signal detected at the Trigger Input 2, helping you verify the signal and troubleshoot any connection or threshold issues (Figure 4).
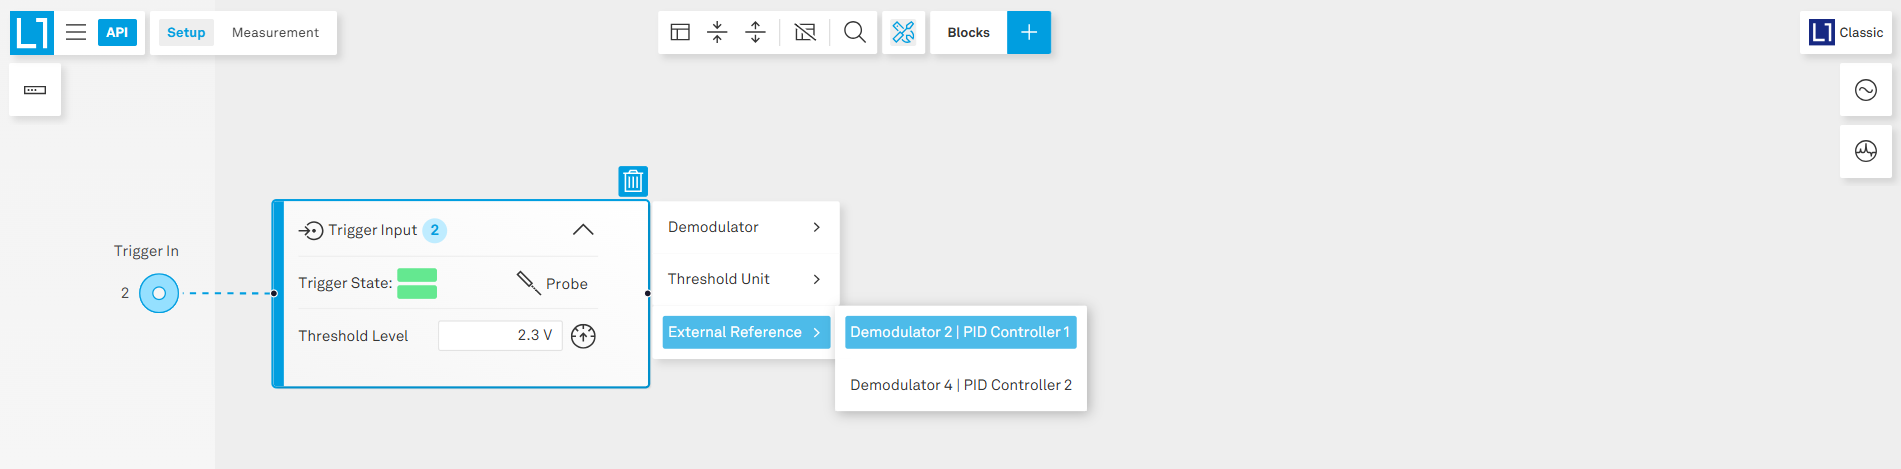
Once the reference signal is detected, close the probe window and click the “+” button on the right side of the Trigger Input 2 block. From the options, navigate to External Reference and assign it to the appropriate Demodulator and PID Controller blocks (e.g., Demodulator 2 and PID Controller 1), as shown in Figure 5. This connects the external reference input for locking purposes.
Ensure the PID Controller or External Reference block is enabled (toggle on) to activate locking. Once the external reference locking is successfully achieved, you should see the measured frequency and the symbol of a green padlock, confirming that the corresponding internal oscillator is properly locked to your external reference signal (Figure 6).
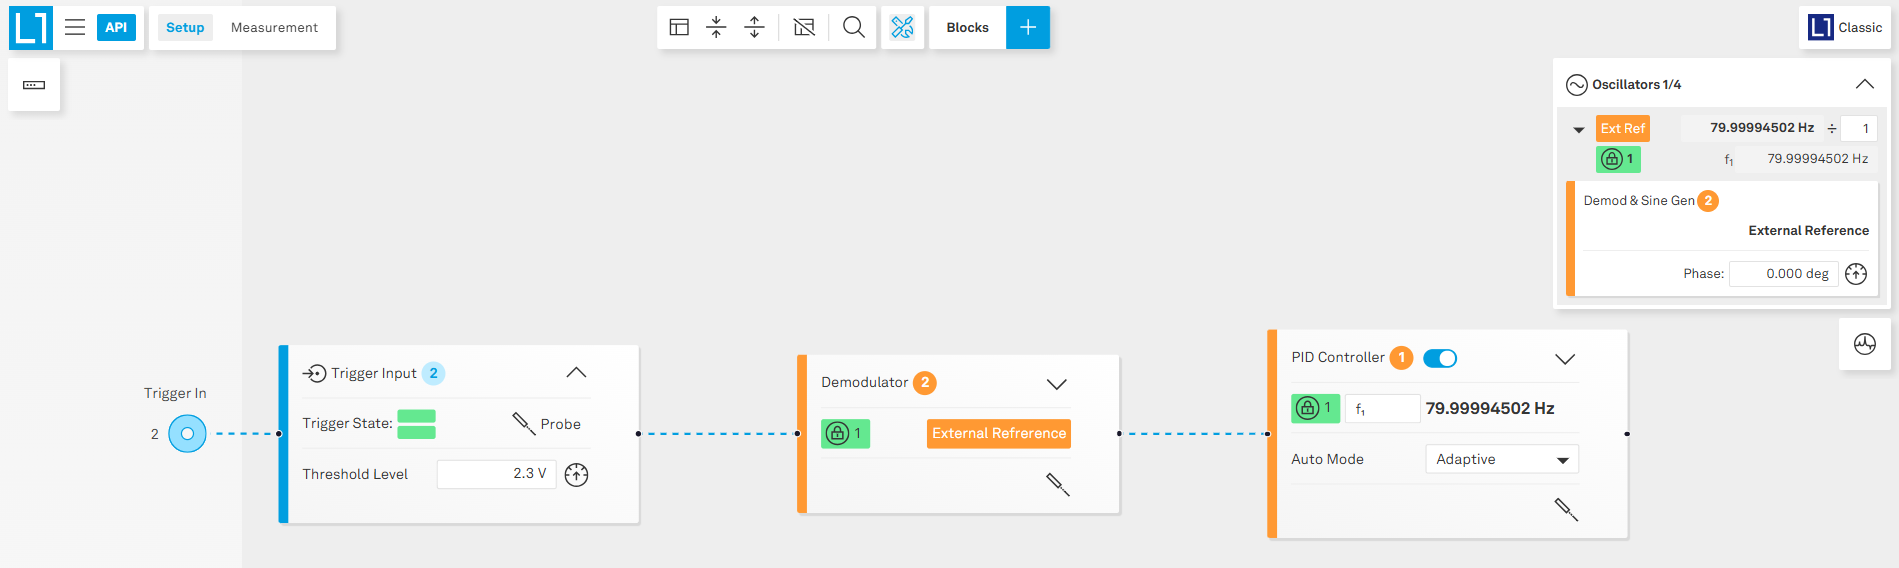
You will also see the locked oscillator displayed on the right-hand side Oscillators panel, as shown in Figure 6. This panel provides a real-time view of the oscillator’s frequency, which should now be locked to the external reference input. On the same panel, you can also set the frequency divider (denoted by “÷”) to lock the oscillator to an integer subharmonic of the reference frequency. For example, setting the divider to 2 will lock the oscillator at half the external reference frequency (40 Hz in this example).
Demodulation of a signal at the external reference frequency
To begin the demodulation process:
- Add a Voltage Input block to the canvas by clicking the “+” button in the top bar and selecting the Voltage Input channel.
- Configure the input range, coupling, and impedance as needed.
- Add a Demodulator block by clicking the “+” on the right side of the Voltage Input block. The demodulator uses the internally locked oscillator to extract amplitude and phase at the reference frequency.
If you wish to demodulate at a harmonic of the reference frequency, you can take advantage of the multiplier (denoted by “× 1”) associated with each oscillator in the right-side Oscillators panel. By adjusting this multiplier, you can set the oscillator frequency to an integer multiple of the reference, enabling demodulation at any desired harmonic.
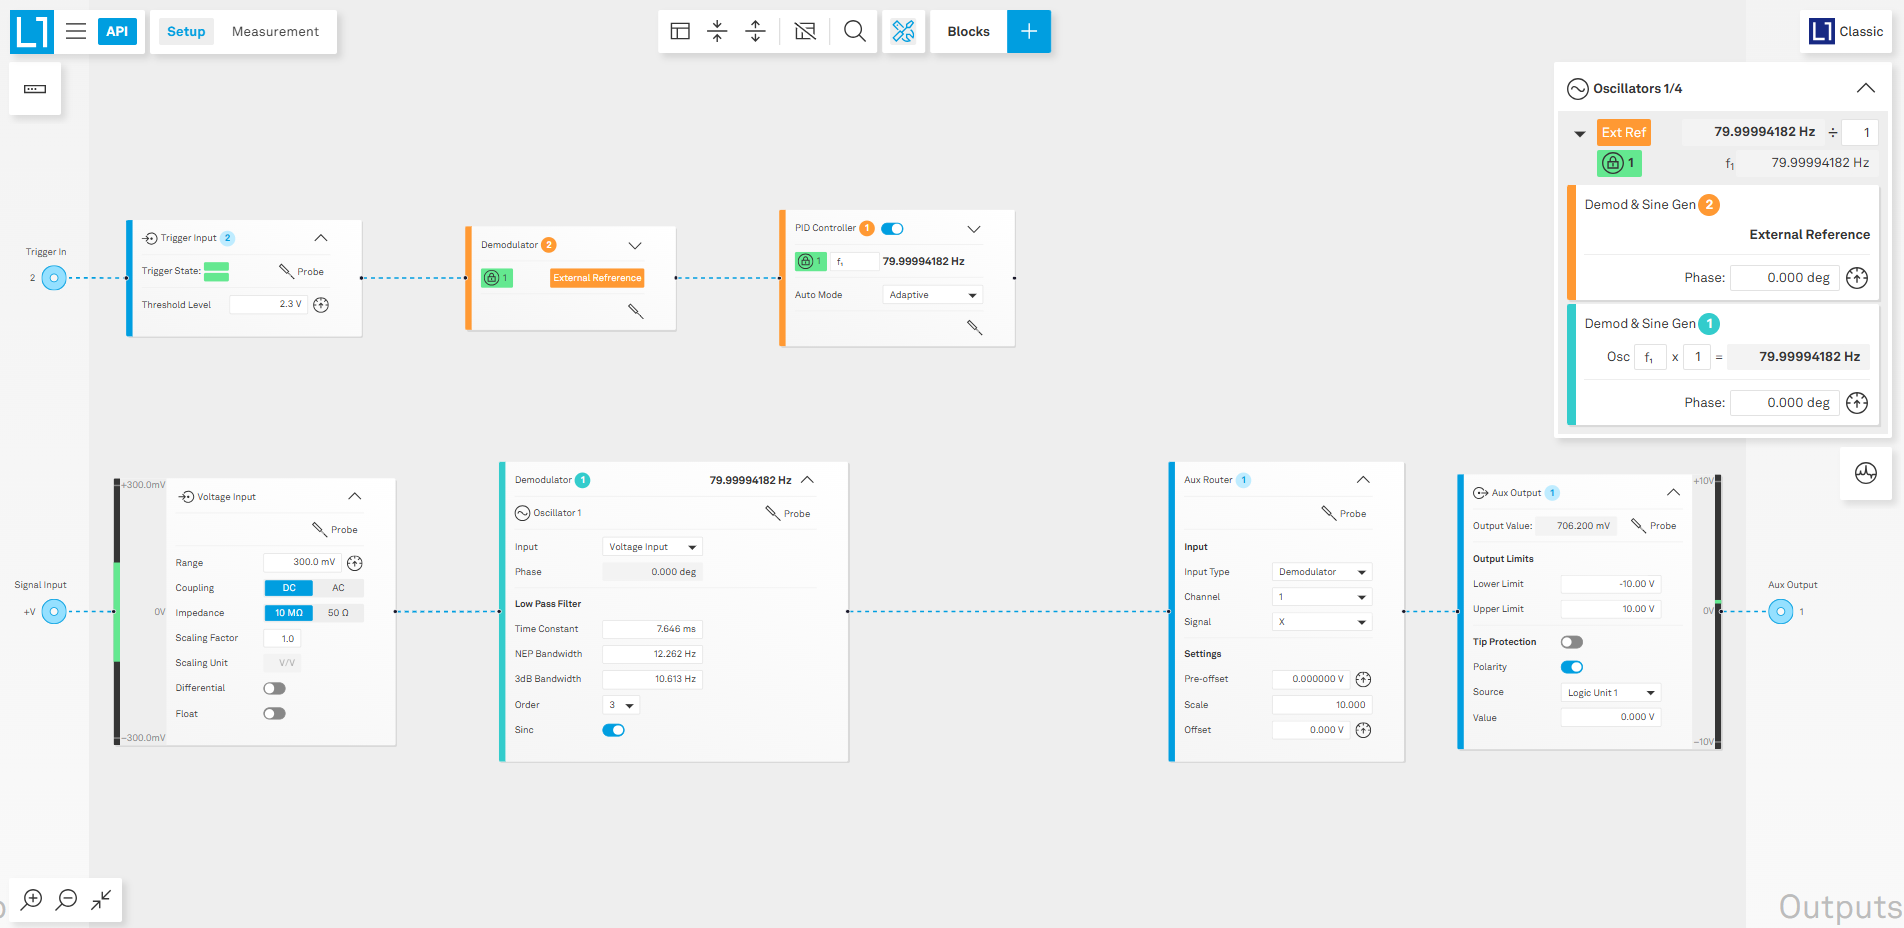
On the demodulator block, you can adjust the demodulator’s low pass filter settings—including time constant, bandwidth, filter order, and sinc filter—to optimize the signal processing for your measurement needs. Here, a 3rd order filter with a bandwidth of approximately 10 Hz is used. To suppress the harmonics of signal frequency leaking to the result, you can enable the sinc filter which is effective for low frequency (<100 Hz) experiments. Optionally, the measurement result can be routed to an Auxiliary Output by adding the corresponding connection on the Demodulator block. The corresponding block diagram is displayed in Figure 7.
Plot the measurement results
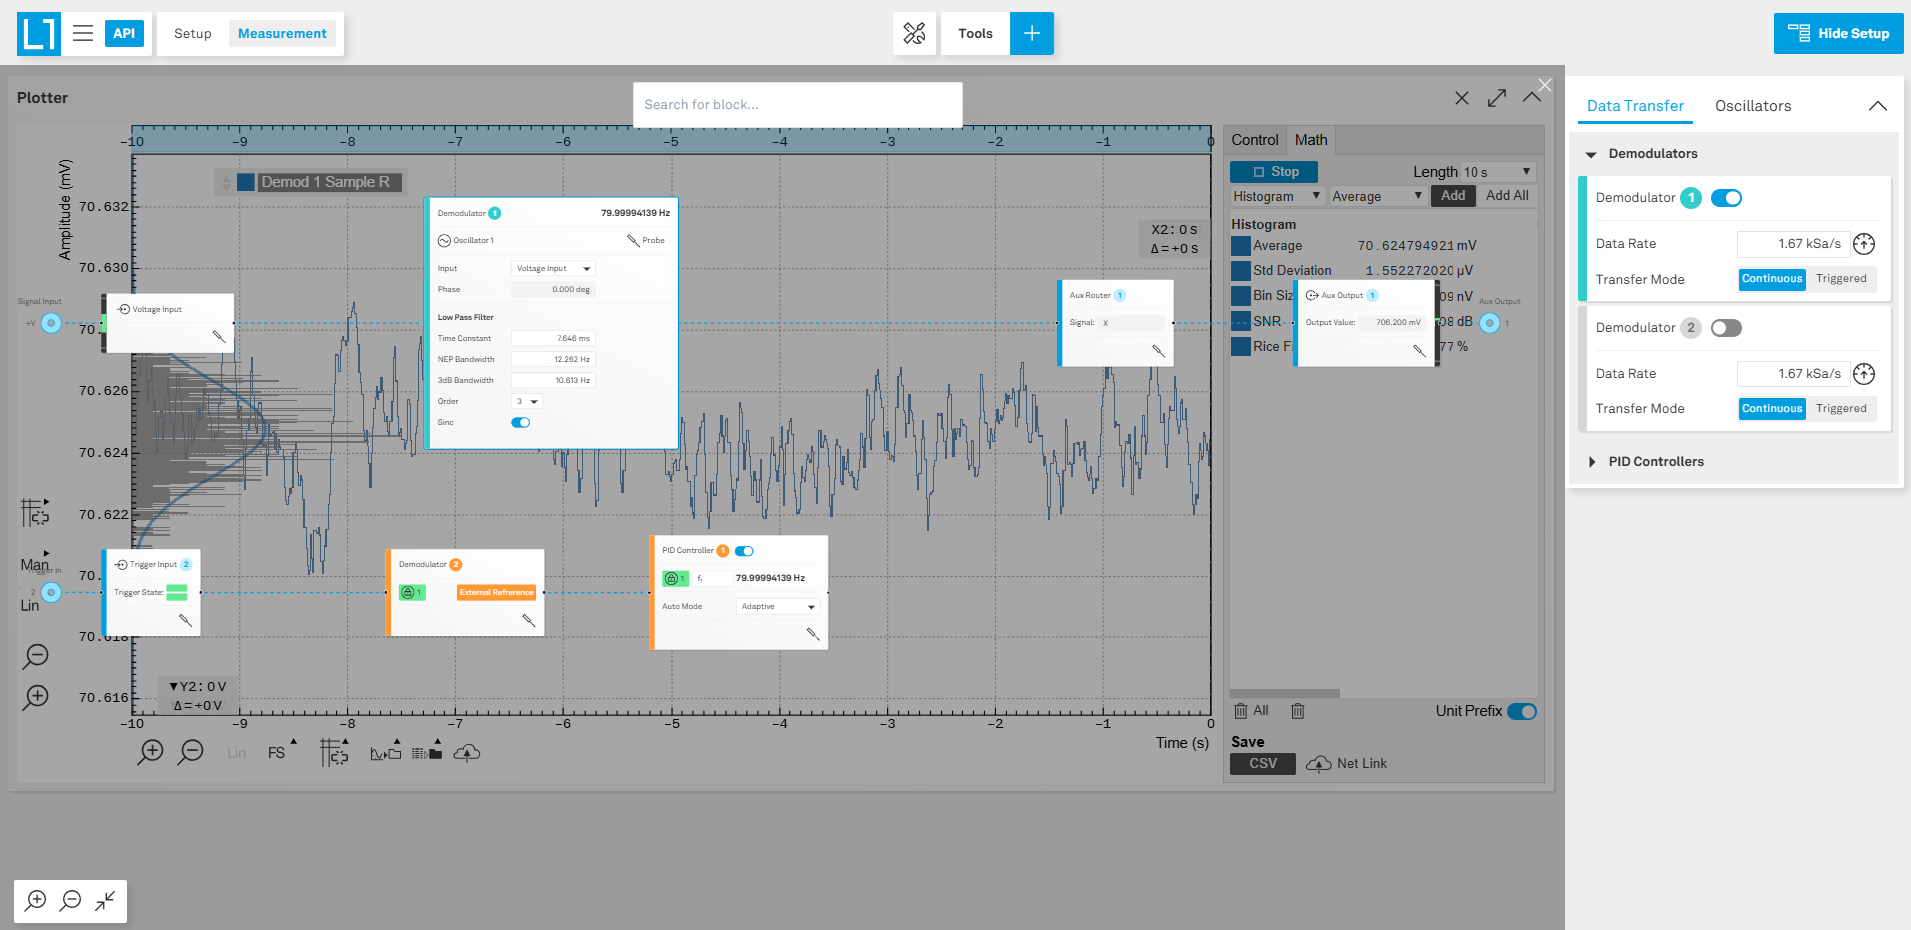
To view and analyze your measurement results, switch to the Measurement workspace by clicking on the Measurement tab at the top left of the interface. In this workspace, you have access to a variety of powerful visualization tools. For example, you can use the Plotter to display the time trace of your demodulated data, allowing you to observe amplitude variations directly over time. Alternatively, you can select the Spectrum Analyzer or other tools by clicking on the “+” button in the top center part of the interface.
On the right-side panel, make sure to enable the Data Transfer toggle for the relevant demodulator channel to ensure your data is sent to the visualization tools. It is important to set a suitable Data Rate for data transfer. This rate should be matched to the low-pass filter setting of your demodulator to achieve optimal sampling—note that you can click the button next to the data rate setting to let the software automatically adjust the data rate for you. Configuring these settings appropriately ensures you capture all relevant measurement information while avoiding excessive data volume or insufficient sampling.
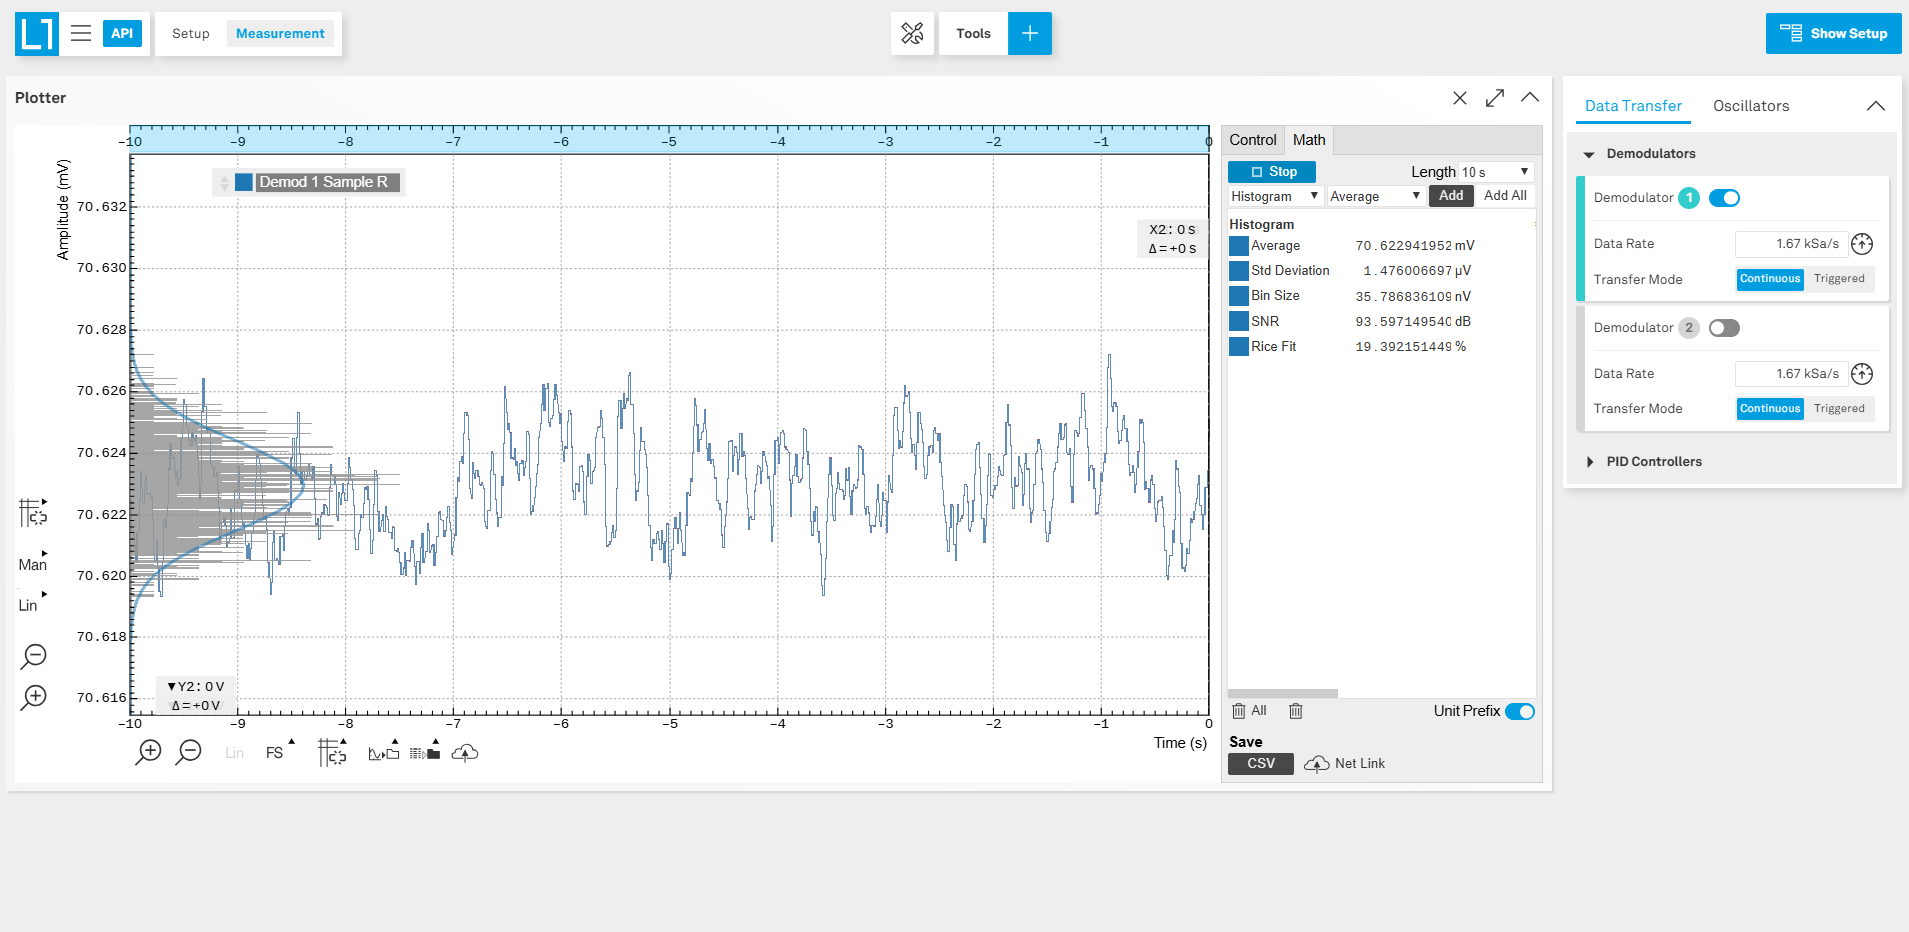
To adjust parameters in real time (e.g. the low-pass filter time constant), overlay the setup diagram by clicking “Show Setup” in the upper right corner (see Figure 9). Changes are reflected instantly in the visualization tool. Alternatively, add the setup as a standalone block by clicking the “+” button and selecting “Setup”.