Troubleshooting
This section helps you avoid and resolve problems that may arise while using the software and operating the instrument.
Common Problems
Your VHFLI lock-in amplifier is an advanced laboratory instrument which has many more features and capabilities than a traditional lock-in amplifier. To benefit from these, you need access to a large number of settings in the LabOne User Interface. To avoid issues, it is good practice to save and load settings in the Config Tab. This simplifies troubleshooting by starting the instrument with known, working configurations.
This section provides an easy-to-follow checklist to solve the most common issues.
| Problem | Check item |
|---|---|
| The software cannot be installed or uninstalled | Verify that you have administrator/root rights. |
| The software cannot be updated (Windows) | Use the Modify option in Windows Apps & Features. In the software installer, select Repair, then uninstall the old version and install the new one. |
| The instrument does not turn on | Verify the power supply connection and inspect the fuse. The fuse holder is integrated in the power connector on the back panel. |
| The instrument cannot be connected over USB | Verify that the instrument is connected through the "USB-C" port. The port labeled "Maintenance" is not intended for normal use and does not support high data rates. |
| The instrument has a high input noise floor (when connected by USB) | The USB cable connects the instrument ground to the computer ground, which may inject noise. Use the Ethernet connection instead, which is galvanically isolated (UTP Cat 5 or 6 cable). |
| The instrument performs poorly at low frequencies (below 100 kHz) | The signal inputs may be set to AC coupling. Turn off the AC switch in the respective Signal Input block in the LabOne User Interface. |
| The instrument performs poorly during operation | The demodulator filters may be set too wide (too much noise) or too narrow (slow response). Verify that the filter settings match your frequency versus noise plan. |
| The instrument performs poorly during operation | Input signal clipping may be occurring. Check the red LEDs on the front panel or the Notification Center in the user interface. Increase the input range margin (e.g. 50%–70% of the maximum signal peak). |
| The instrument performs strangely when working with the VHF-MD Multi-demodulator Option | More signal generators than intended may be active. Check the Signal Output with the integrated oscilloscope and verify the number of simultaneously activated oscillator voltages. |
| The instrument performs close to specification, but higher performance is expected | Analog parameters may drift after 2 years. This can cause inaccurate measurements. Zurich Instruments recommends recalibration every 2 years. |
| The instrument measurements are unpredictable | Check the Notification Center in the User Interface for active errors (red) or warnings (yellow). |
| The instrument does not generate any output signal | Verify that the signal output switch is enabled in the corresponding Signal Output block. |
| The sample stream from the Instrument to the host computer is not continuous | Check for communication (COM) flags in the Notification Center. Sample loss occurs when a sampling rate is set too high (the instrument sends more samples than the interface and the host computer can absorb). The packet loss indicates an important failure of the communications to the host computer and compromises the behavior of the instrument. Both problems are prevented by reducing the sample rate settings. The stall flag indicates that a setting was actively changed by the system to prevent UI crash. |
| The LabOne User Interface does not start | Verify that the LabOne Data Server (ziDataServer.exe) and the LabOne Web Server (ziWebServer.exe) are running via the Windows Task Manager. The Data Server should be started automatically by ziService.exe and the Web Server should be started upon clicking "Zurich Instruments LabOne" in the Windows Start Menu. If both are running, but clicking the Start Menu does not open a new User Interface session in a new tab of your default browser then try to create a new session manually by entering 127.0.0.1:8006 in the address bar of your browser. |
| The user interface does not start or starts but remains idle | Verify that the Data Server has been started and is running on your host computer. |
| The user interface is slow and the web browser process consumes a lot of CPU power | Make sure that the hardware acceleration is enabled for the web browser that is used for LabOne. For the Windows operating system, the hardware acceleration can be enabled in Control Panel → Display → Screen Resolution. Go to Advanced Settings and then Trouble Shoot. In case you use a NVIDIA graphics card, you have to use the NVIDIA control panel. Go to Manage 3D Settings, then Program Settings and select the program that you want to customize. |
| The instrument does not appear in the Available Devices list or is not detected by the API (when connected via 1GbE) | Verify that the instrument is properly connected to your network. If still not visible, there may be a network configuration issue. Try connecting directly via USB. See Connecting to the Instrument for more information. |
Location of the Log Files
The most recent log files of the LabOne Web and Data Server programs are
most easily accessed by clicking on  in the LabOne Device Connection
dialog
of the user interface. The Device Connection dialog opens on software
start-up or upon clicking on
in the LabOne Device Connection
dialog
of the user interface. The Device Connection dialog opens on software
start-up or upon clicking on  in the Config tab of the user interface.
The location of the Web and Data Server log files on disk are given in the sections below.
Windows
The Web and Data Server log files on Windows can be found in the following directories.
-
LabOne Data Server (
ziDataServer.exe):C:\Windows\ServiceProfiles\LocalService\AppData\Local\Temp\Zurich Instruments\LabOne\ziDataServerLog -
LabOne Web Server (
ziWebServer.exe):C:\Users\[USER]\AppData\Local\Temp\Zurich Instruments\LabOne\ziWebServerLog
Note
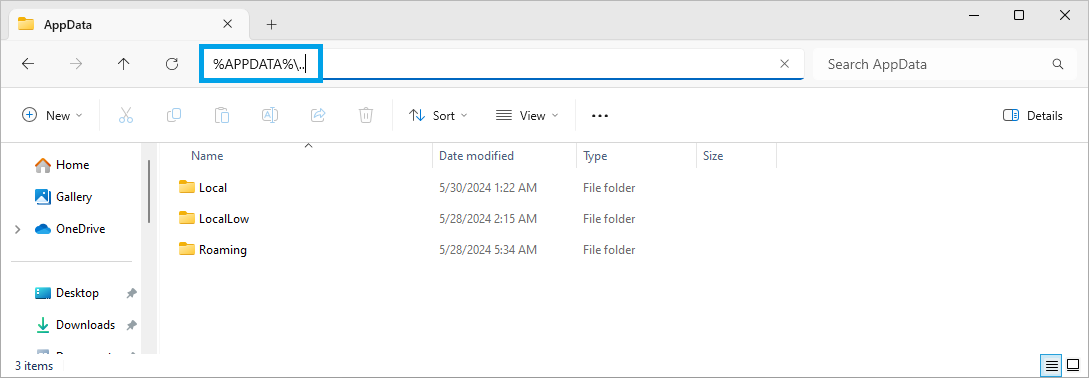
The C:\Users\[USER]\AppData folder is hidden by default under Windows.
A quick way of accessing it is to enter %AppData%\.. in the address
bar of the Windows File Explorer.
Linux and macOS
The Web and Data Server log files on Linux or macOS can be found in the following directories.
-
LabOne Data Server (
ziDataServer):/tmp/ziDataServerLog_[USER] -
LabOne Web Server (
ziWebServer):/tmp/ziWebServerLog_[USER]
Prevent web browsers from sleep mode
It often occurs that an experiment requires a long-time signal acquisition; therefore, the setup including the measurement instrument and LabOne software are left unattended. By default, many web browsers go to a sleep mode after a certain idle time which results in the loss of acquired data when using the web-based user interface of LabOne for measurement. Although it is recommended to take advantage of LabOne APIs in these situations to automate the measurement process and avoid using web browsers for data recording, it is still possible to adjust the browser settings to prevent it from entering the sleep mode. Below, you will find how to modify the settings of your preferred browser to ensure a long-run data acquisition can be implemented properly.
Edge
-
Open Settings by typing
edge://settingsin the address bar -
Select System from the icon bar.
-
Find the Never put these sites to sleep section of the Optimized Performance tab.
-
Add the IP address and the port of LabOne Webserver, e.g.,
127.0.0.1:8006or192.168.73.98:80to the list.
Chrome
-
While LabOne is running, open a tab in Chrome and type
chrome://discardsin the address bar. -
In the shown table listing all the open tabs, find LabOne and disable its Auto Discardable feature.
-
This option avoids discarding and refreshing the LabOne tab as long as it is open. To disable this feature permanently, you can use an extension from the Chrome Webstore.
Firefox
-
Open Advanced Preferences by typing
about:configin the address bar. -
Look for
browser.tabs.unloadOnLowMemoryin the search bar. -
Change it to false if it is true.
Opera
-
Open Settings by typing
opera://settingsin the address bar. -
Locate the User Interface section in the Advanced view.
-
Disable the Snooze inactive tabs to save memory option and restart Opera.
Safari
-
Open Debug menu.
-
Go to Miscellaneous Flags.
-
Disable Hidden Page Timer Throttling.