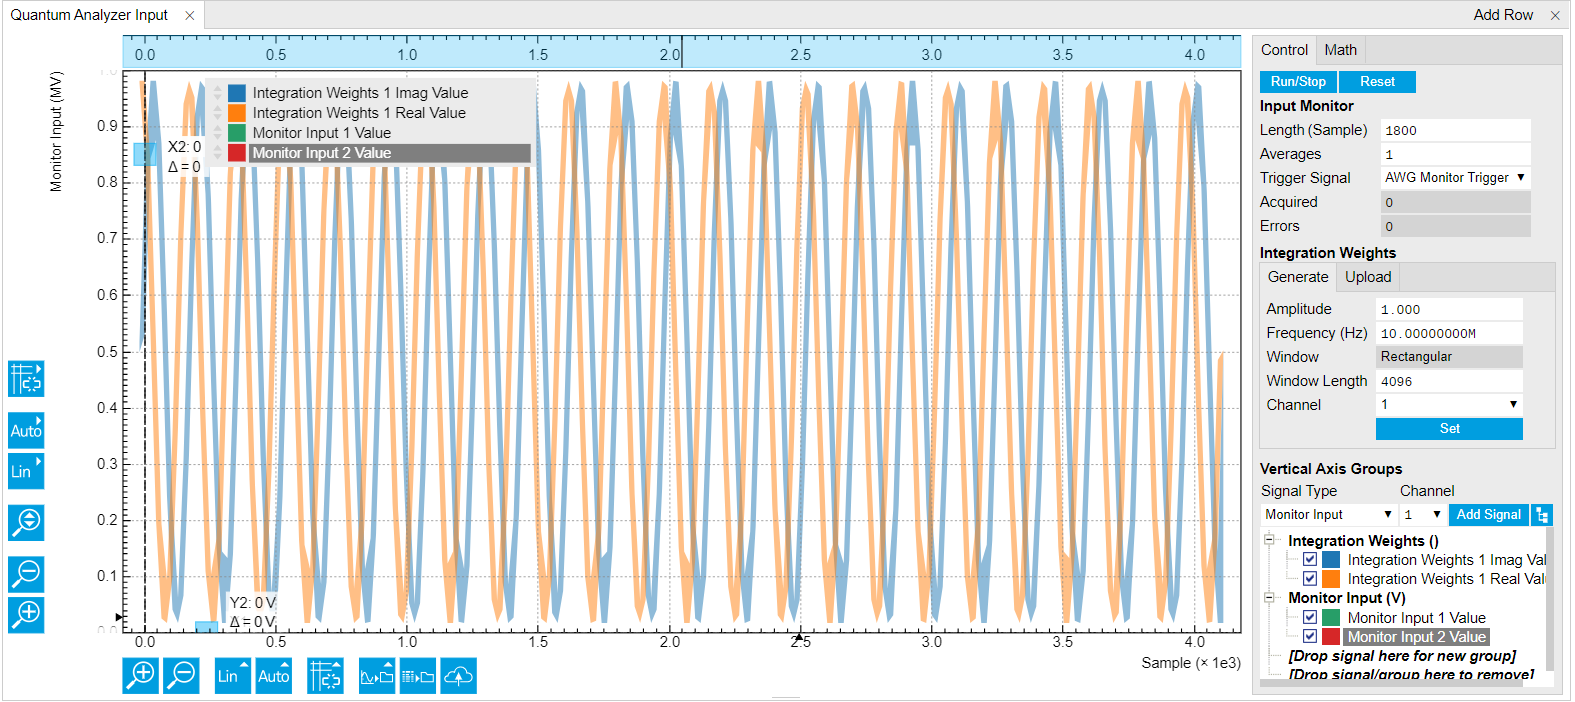
Quantum Analyzer Input Tab
The Quantum Analyzer Input tab is the interface to the input monitor unit of the instrument (see functional overview for an overview block diagram). It is available on all UHFQA instruments.
Features
- Input Monitor with 4 kSa memory for raw signal display
- Raw signal averaging
- Display of integration weights
- Setting of basic integration weights with
- CSV upload of integration weights
Description
| Control/Tool | Option/Range | Description |
|---|---|---|
| QA Input | Configure the Weighted Integration units and Monitoring Scope |
The Quantum Analyzer Setup tab (see LabOne UI: Quantum Analyzer Input tab) is divided into a display section on the left and a configuration section on the right. This tab represents the interface to the following functional blocks of the input monitor and the integration weight memory. A block diagram representing the flow of data and trigger signals between the functional blocks is found in Architecture and Signalling.
The Input Monitor is an averaging scope with 4 kSa memory dedicated to measuring the raw signal response to a readout pulse containing a single or multiple carrier frequencies. The Input Monitor is triggered by the UHF-AWG via one dedicated line of the internal trigger. In an AWG Sequencer program (see AWG Tab), this trigger is activated by setting the corresponding bit to high and to low again using the following instructions:
setTrigger(AWG_MONITOR_TRIGGER);
setTrigger(0);
The Integration Weights section represents the integration weights used
by the qubit measurement unit. In the typical case, the readout pulse is
generated by the UHF-AWG on Signal Outputs 1 and 2, upconverted to a
sideband of a local oscillator LO using an I/Q mixer, it passes through
the device under test, gets downconverted using an I/Q mixer and the
same local oscillator LO, and is acquired by the UHFQA on Signal Inputs
1 and 2. The simplest type of weight function are sinusoid functions at
the sideband frequency generated by the AWG. These types of weight
functions can easily be written to the instrument memory by selecting a
carrier frequency (positive or negative), length in samples, channel,
and then clicking on  .This
basic type corresponds to an unmatched filter with a sinc profile in
frequency space. For more advanced measurements using matched filters,
the weight function can be freely programmed using the API, or using the
File Upload sub-tab.
.This
basic type corresponds to an unmatched filter with a sinc profile in
frequency space. For more advanced measurements using matched filters,
the weight function can be freely programmed using the API, or using the
File Upload sub-tab.
Similarly to the Input Monitor, the weighted integration is controlled
by dedicated internal trigger lines. There is one trigger line to arm
the trigger of the weighted integration which can be accessed using the
sequencer constant AWG_INTEGRATION_ARM. A second line is used to
generate the actual trigger and can be accessed using the constant
AWG_INTEGRATION_TRIGGER. The following instructions can be used as a
template for use in an AWG sequence program:
setTrigger(AWG_INTEGRATION_ARM); // arm the integration unit
(...)
setTrigger(AWG_INTEGRATION_ARM + AWG_INTEGRATION_TRIGGER); // trigger the integration unit
setTrigger(AWG_INTEGRATION_ARM); // reset the trigger
Functional Elements
| Control/Tool | Option/Range | Description |
|---|---|---|
| Run/Stop | Run the Input Monitor scope. | |
| Length | The duration of each capture in samples. A maximum of 4096 samples can be captured, which corresponds to 2.3 µs. | |
| Average Count | Number of averages to perform. | |
| Monitor Trigger Selection | Select the source for triggering the input monitor. | |
| Trigger Input 1 | Use the Trigger Input 1 as the trigger signal. | |
| Trigger Input 2 | Use the Trigger Input 2 as the trigger signal. | |
| Trigger Input 3 | Use the Trigger Input 3 as the trigger signal. | |
| Trigger Input 4 | Use the Trigger Input 4 as the trigger signal. | |
| AWG Monitor Trigger | Use the AWG Monitor Trigger as the trigger signal. | |
| Acquired | Indicates the index of the acquisition that will be performed on the next trigger. | |
| Errors | Number of hold-off errors detected since last reset. | |
| Reset | Clear the Input Monitor scope. | |
| Amplitude | Amplitude of the complex exponential function. | |
| Set Mode | Set Integration Weights by parametric generation or CSV Upload. | |
| Parametric | Integration Weights are generated by defining sine wave parameters. | |
| Upload | Integration Weights are uploaded by the user in a form of a CSV file. | |
| Frequency | Frequency of the complex exponential function. | |
| Phase | Phase of the complex exponential function. | |
| Window Type | Window function to be applied to the complex exponential function. | |
| Window Length | Length of the selected window starting from zero position. | |
| Integration Weight | Selects the Integration Weight for parametric or arbitrary waveform upload. | |
| Set To device | Write the real and imaginary part of the Waveform to the selected Integration Weight. | |
| Set To Device | Write the real and imaginary part of the Waveform to the selected Integration Weight. | |
| CSV File | Drag and drop CSV file containing columns of integration weights. |