Functional Overview
This chapter provides the overview of the features provided by the PQSC Instrument. The first section contains the description of the graphical overview and the hardware and software feature list. The next section section details the front panel and the back panel of the instrument. The following section provides product selection and ordering support.
Features

The PQSC Instrument according to Figure 1 consists of several internal units (light blue color) surrounded by several interface units (dark blue color) and the back panel on the right-hand side. The arrows between the panels and the interface units indicate selected physical connections and the data flow.
The PQSC comes with 18 ZSync ports to connect with the Zurich Instruments SHFQC, SHFSG and HDAWG for qubit control and with the Zurich Instruments SHFQC, SHFQA and UHFQA for qubit readout. This scalable architecture supports setups with more than 100 accurately synchronized AWG channels, and provides status monitoring to ensure quality and reliability of qubit tune-up routines. The ZSync links distribute the system clock to all instruments and synchronize all instruments with sub-nanosecond precision. Further, the links provide a bidirectional data interface to send qubit readout results to the PQSC for central processing, and to send trigger signals to the connected instruments to initiate synchronized actions. The ZSync links adhere to strict real-time behavior: all data transfers are predictable to single-clock-cycle precision. This enables the implementation of rapid tune-up procedures, syndrome decoding, and error correction routines. The LabOne control software provides a high-level interface to all instruments in the system and comes with APIs for Python, C, MATLAB®, LabVIEW®, and .NET.
Clock
- Input frequency: Auto-detect 10 MHz / 100 MHz
- Input coupling: 50 Ω, SMA connector
- Output frequency: Switchable 10 MHz / 100 MHz
- Output amplitude: >1 Vpp in 50 Ω
Connectivity
- Host connection: LAN / Ethernet, 1 Gbit/s, USB 3.0
- Device connection: 18 ZSync ports
- ZSync communication latency: < 100 ns
- Trigger: 2 trigger inputs, 2 trigger outputs, 3.3 V TTL on SMA connector
- Digital I/O: 32 bits, 3.3 V TTL, general purpose
Software Features
- Web-based, high-speed user interface with multi-instrument control
- Data server with multi-client support
- API for C, LabVIEW, MATLAB, Python based instrument programming
Front Panel Tour
The front panel Control LEDs are arranged as shown in Figure 2 and listed in Table 1.

| Position | Label / Name | Description |
|---|---|---|
| A | Power | device status LED
|
| B | Sync | Unused. It might flash during instrument start |
Back Panel Tour
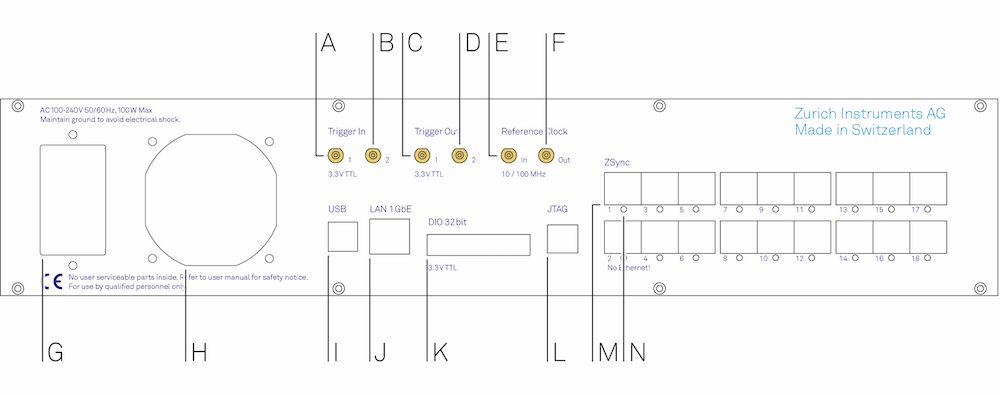
The back panel is the main interface for power, control, service and connectivity to other ZI instruments. Please refer to Figure 3 and Table 2 for the detailed description of the items.

| Position | Label / Name | Description |
|---|---|---|
| A | Trigger In 1 | digital trigger input |
| B | Trigger In 2 | digital trigger input |
| C | Trigger Out 1 | digital trigger output |
| D | Trigger Out 2 | digital trigger output |
| E | Reference Clock In | reference clock input (10 MHz / 100 MHz) for synchronization with other instruments |
| F | Reference Clock Out | reference clock output (10 MHz / 100 MHz) for synchronization with other instruments |
| G | AC 100 - 240 V | power inlet and power switch |
| H | - | ventilator (important: keep clear from obstruction) |
| I | USB | universal serial bus host computer connection |
| J | LAN 1 GbE | 1 Gbit LAN connector for connection to the host computer |
| K | DIO 32bit 3.3 V TTL | 32-bit digital input/output connector |
| L | JTAG | connector for programming and debugging the FPGA |
| M | ZSync | 18 ZSync ports. Inter-instrument synchronization bus connector - attention: this is not an Ethernet plug, connection to an Ethernet network might damage the instrument. |
| N | ZSync | 18 ZSync port synchronization LEDs. Shows the status of the corresponding ZSync port link
|